# Install pacman if you have not
# install.packages("pacman")
pacman::p_load("summarytools", "palmerpenguins")To effectively analyze data, understanding the characteristics of variables in the dataset is crucial.
Generating a comprehensive summary of variables helps to identify duplicates, important variables, and necessary transformations based on their distributions. In this post, I will generate a summary report using the summarytools package in R, and also ahow how to avoid common mistakes. This technique is useful for datasets of any size and facilitates efficient data analysis.
Libraries required
Summarize the data
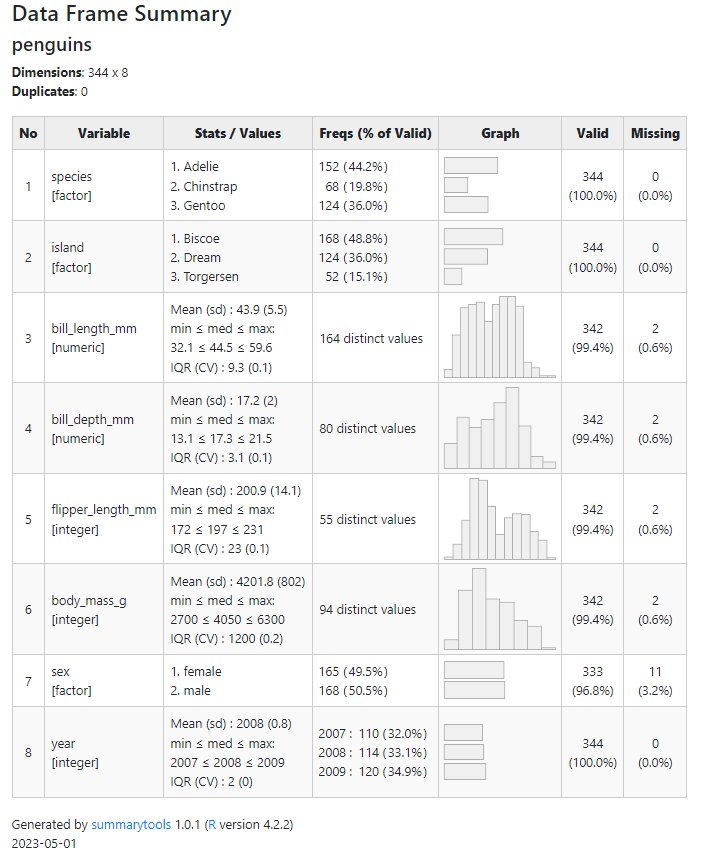
view(dfSummary(penguins))Output
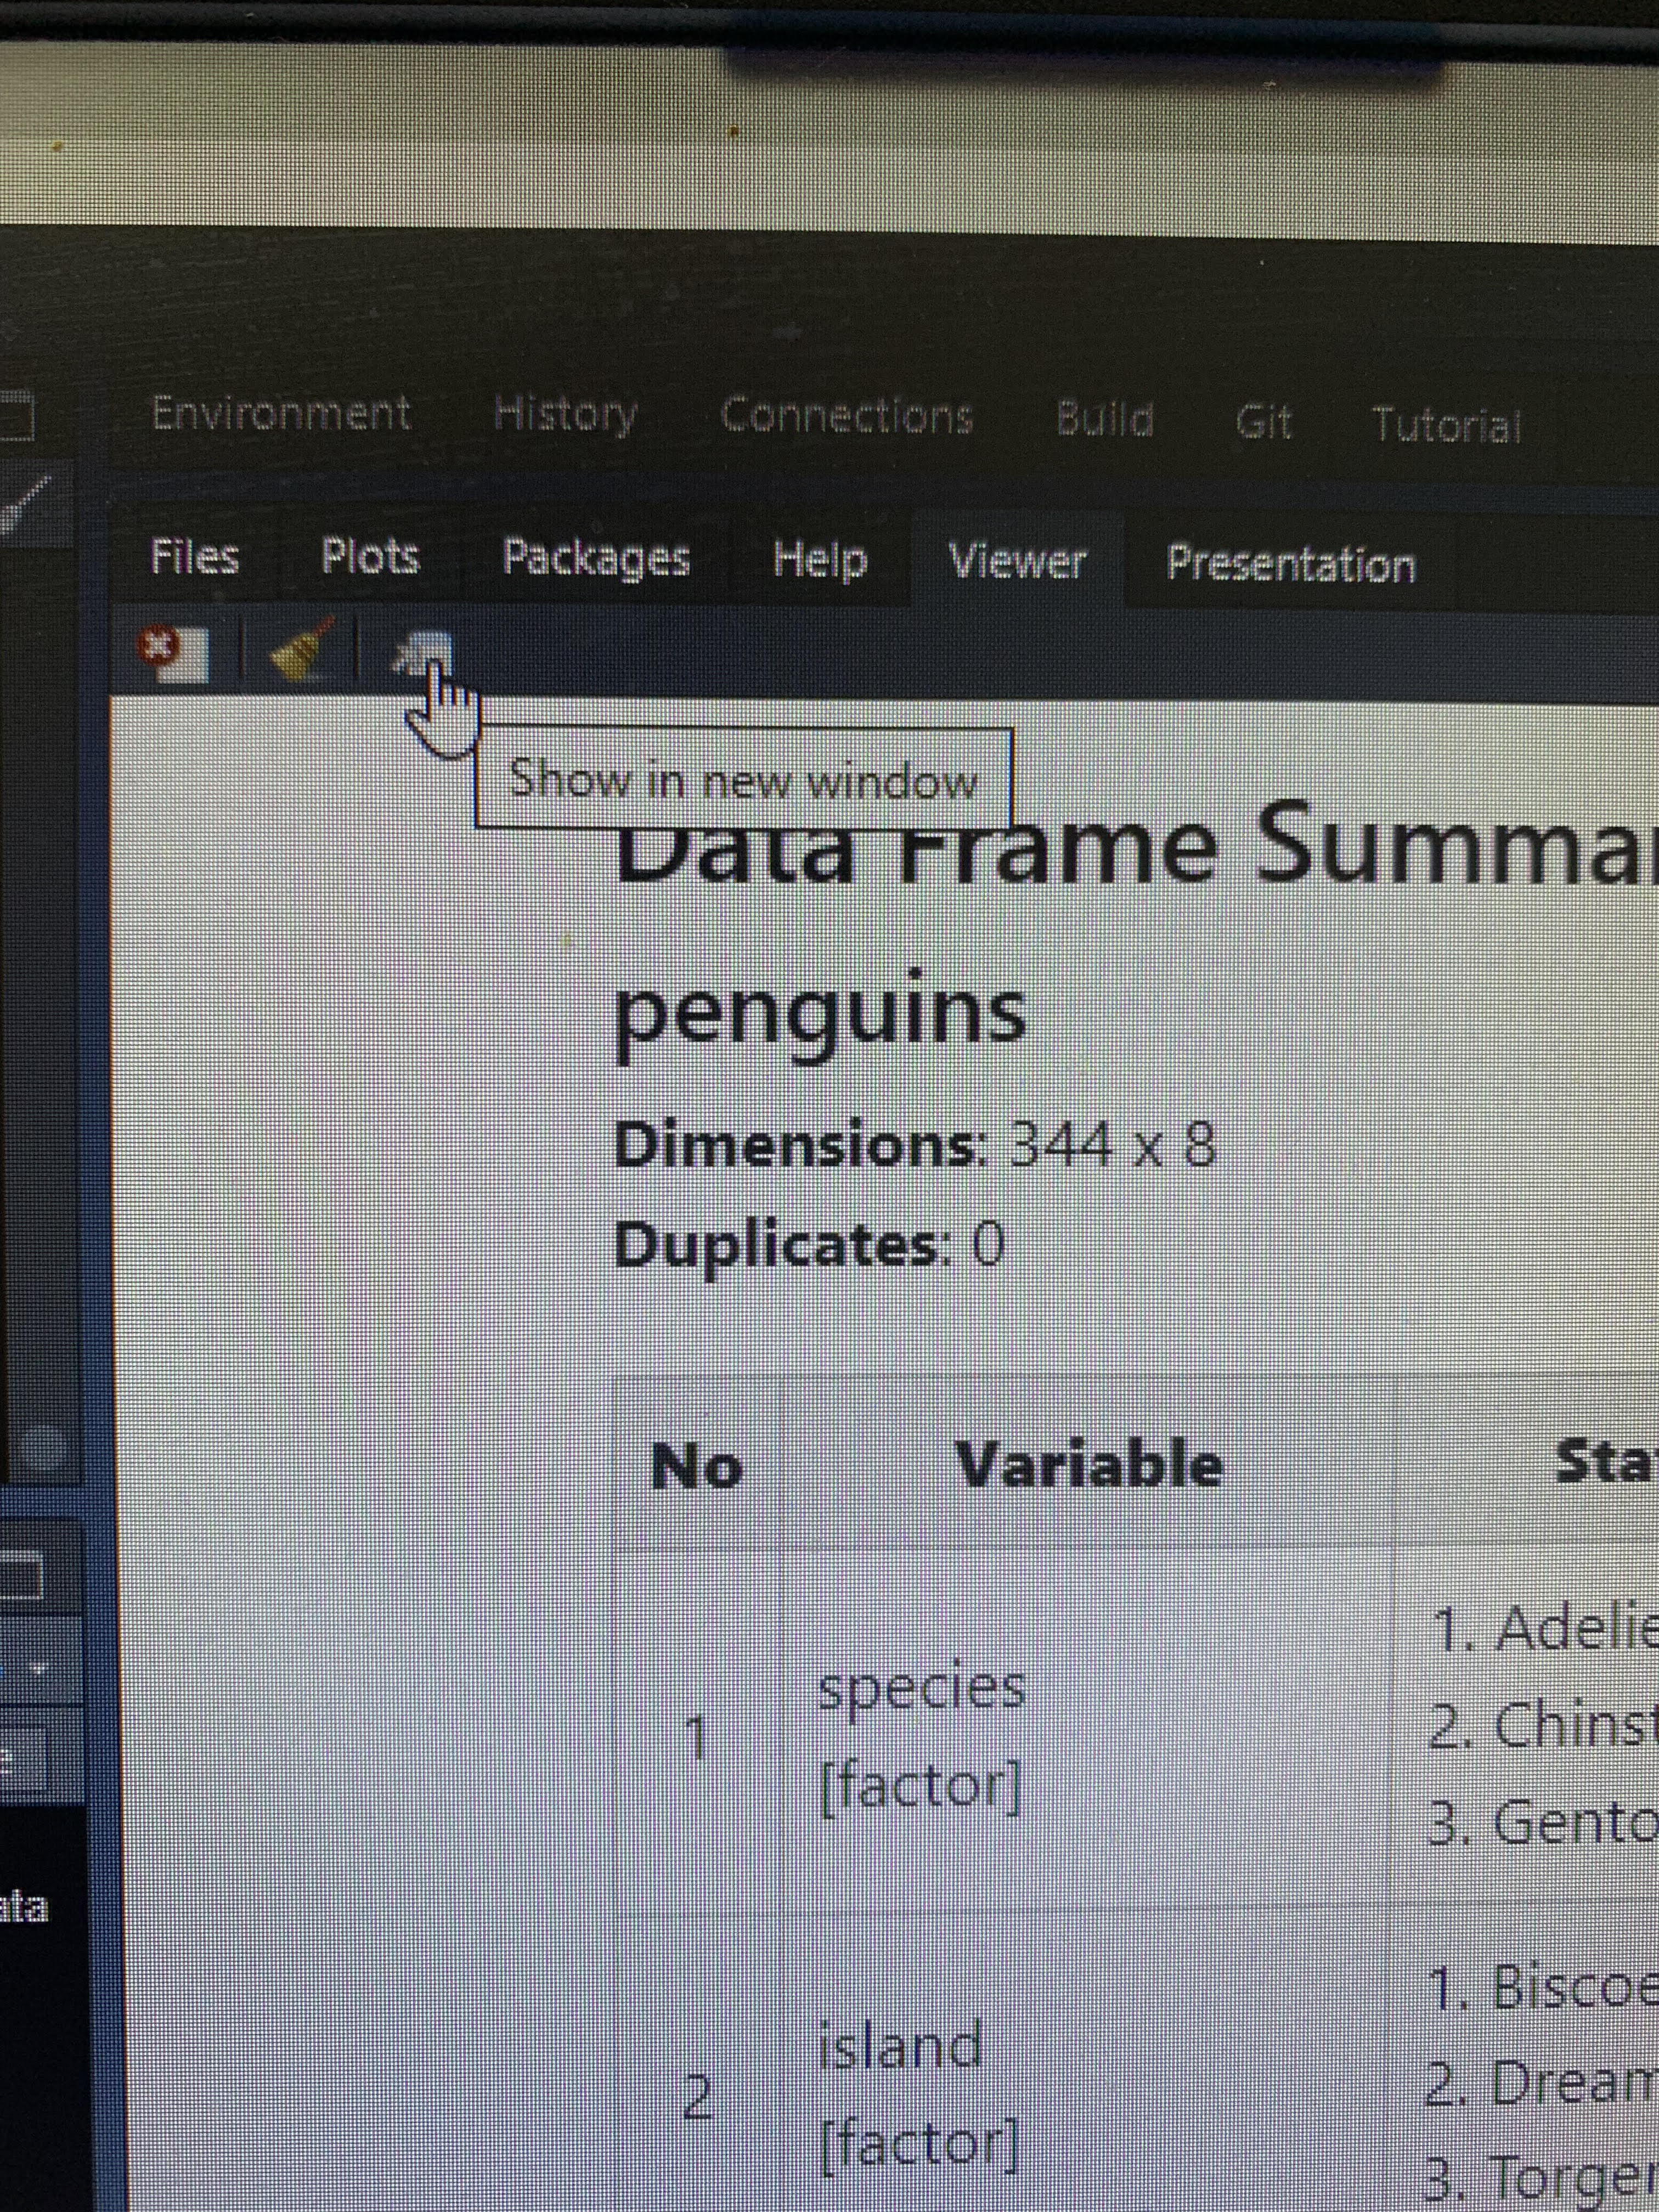
The output appears in the viewer pane, where categorical and continuous variables are charted with bar or histogram formats, respectively.
To save the output, simply click ‘show in new window’ and then right-click the opened browser window to save it to the desired location.
Mistake to avoid
A common beginner’s mistake is to use the View() function instead of the view() function (with a small ‘v’). The former opens the dataset in R, whereas the latter is a function of the summarytools package used to create the output.
Why this works?
I initially developed this summary report during my postdoctoral research, and my supervisor was impressed by its ability to provide a concise, one-page summary of important variables, complete with a graphic overview that is useful for downstream decision-making.
Before you dive into the depths of data, take flight with a bird’s eye view of the dataset at hand